How do you stack up?
Keep reading. The results may surprise you.
HMT readers are everyone from healthcare CEOs to IT and clinical directors, medical records and audit mangers to legal consultants, and everything in between. By nature, our readership – and the HIT industry as a whole – is a diverse one, made up of a variety of people, each with a unique background and skill set.
C-Suite individuals, including VPs, make up 16.7 percent of our survey audience. IT directors and other health IT workers comprise 60.6 percent, while general administrators (19.7 percent) and others (3 percent) round out the mix.
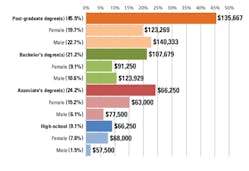
Next, we looked at the educational history of those who responded. The details in Figure 1 (Education and gender by salary) illustrate the spread, with most (45.5 percent) reporting they earned a post-graduate degree. High school educations came in at the bottom, with 9.1 percent reporting only a GED or diploma. Unsurprisingly, the level of education was directly proportional to average compensation. Where things get interesting is when we break down these numbers according to gender and take another look at the findings.
Women with only a high school education made more than their male counterparts. However, as we move up the scale to look at those with bachelor’s degrees and a post-graduate education, a significant gender-based wage gap is revealed in the opposite direction, with women making from $14,500 to $32,679 less per year than their male counterparts at higher education levels.
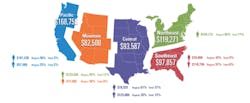
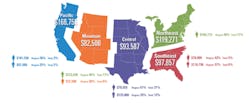
Taking away the gender variable, the compensation reported by readers ranged widely, with the median coming in at exactly $100,000 annually – not including bonuses and benefits.
When asked if their compensation had increased since last year, the results indicated a general “yes.” Almost seven in 10 (68.2 percent) reported they received a raise since last year. Almost two in five (37.9 percent) reported an increase of less than 3 percent. Fewer still (16.7 percent) reported an increase of 5 percent or more, signaling a slow growth for wages. The majority of those who received an increase (85.1 percent) said their raise was based on job performance. Only 8.5 percent of respondents reported a salary change due to a promotion, while a slightly smaller number (6.4 percent) said their increase was due to a change in responsibilites.
The details
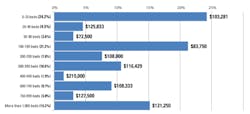
Now that we know a little bit about compensation, we take a look at the facilities in which respondents work, as well as their corresponding salaries. Figure 2 (Average salary by facility size) illustrates the breakdown, comparing the size of the facility to average respondent compensation. What is perhaps most surprising is the fact that 24.2 percent of HMT readers reported working in a facility with 25 beds or less, coming in at an average salary of $103,281 per year. On the far end of the spectrum, those who reported working in facilities with 1,000 beds or more saw an average wage of $121,250. Those in the middle show a huge fluctuation in salary, averaging from $72,500 (50 to 99 beds) to upward of $215,000 for the one respondent who reported working in a facility with 400 to 499 beds.
In an attempt to explain this variation, we can look at the facility types. Most (53 percent) said they worked for a non-profit, as opposed to for-profit, facilities (30.3 percent). Government-owned practices came in at 15.2 percent, and 1.5 percent stated they worked at “none of the above.” Average compensation trended downward respectively, with those who worked for non-profits reporting $117,857, as opposed to those who worked for a government-owned practice showing an average salary of $89,500. The average for-profit salary was $96,875.
Comparisons between number of beds and type of practice were not aggregated. However, the results seem to suggest those who work for non-profits make on average more than those in comparable government-owned or for-profit facilities.
Finally, it’s important to mention job security. The vast majority (89.4 percent) of respondents reported they either felt “very secure” or “somewhat secure” in their current position, with 10.6 percent of respondents saying they felt “somewhat insecure.” In an economy where so many health systems are facing buyouts and mergers, having some respondents report a certain level of employment apprehension isn’t very surprising.
Demographic information
The HMT readers who responded to the salary survey were 51.5 percent female and 40.9 percent male. The remaining percentage chose not to provide a gender identity. In their positions, most seemed to be leaders responsible for the evaluation, purchasing, reviewing, or selecting of vendor products (74.2 percent), with the remaining 25.8 percent indicating they were responsible for none of the above.
When asked what issues facing healthcare were important to them, respondents overwhelmingly chose potential budget cuts and restraints as their primary concern (40.9 percent), followed closely by data security (36.4 percent). Other issues of importance were interoperability (28.8 percent) and EHR/EMR compliance (27.3 percent). Meaningful Use objectives (25.8 percent), security (24.2 percent), and data analytics (22.7 percent) were also top concerns.
As for which systems and products our respondents are looking to replace in the coming year, 28.8 percent indicated they are in the market for a new or improved EMR/EHR system. Cybersecurity advancements, clinical informatic systems, and data storage each saw 21.2 percent of respondents saying they were seeking new products and upgrades to help in these areas. Displays, computers, and printers (18.2 percent) and workstations and carts (18.2 percent) were next on the list.
For a full inforgraphic featuring more detailed statistics, click here.


